What marketer hasn’t had to not only identify their industry’s social media benchmarks but track their brand’s social media analytics against those benchmarks? As marketers, we’ve come to understand that the success (or failure) of our social media performance rests on how our data holds up not only to our competitors’ but also to industry standards.
If you’ve been a social media marketer for any length of time, you know that it’s nearly impossible to prove the value of follower growth rates or engagements. Holding your numbers up against a competitor’s, and the industry as a whole, helps us determine how well our social media strategy is performing.
Social media success depends on a host of variables from objectives to audience size. But in general, having the right industry benchmarks is a good place to start.
How to Find Social Media Benchmarks
There are many sources online that provide a wide array of social media benchmarks for different social channels, industries, and key performance indicators (KPIs). A quick Google search will turn up dozens. There are a few important considerations to keep in mind when searching for benchmarks.
- Publish Date. Because social media moves fast and is ever-evolving, benchmark data is a continually moving target, too. Look for benchmarks within the past 6 months. Anything older than that is outdated.
- Source. The internet has an unlimited supply of information, and as you know, some of it is better than others. If you’re searching online for industry benchmarks, be sure the source is reputable. If you’ve not heard of the company, do your research! Credible, well-known organizations will provide the most trustworthy data. RivalIQ and Sprout Social are two sources we look to for benchmark data. It’s worth noting that at aB, we take an average of several trusted sources, taking all variables into consideration, as well. It’s a practical science born from years of practice.
- Social Platform. Every platform has different benchmarks and specific KPIs to measure. Be sure you’re looking at data for the appropriate social media platform. Here, we’ll be looking exclusively at LinkedIn, however you can apply the same principles to Instagram, Facebook, and so on.
- Organic vs. Paid. These are two very different sets of data. Rather than lump them together, keep them separate so that you can correctly measure the success of your organic campaign and your paid social efforts. Pay attention to which KPIs are strongest across each. For example, you’ll likely find that your organic engagement rate far exceeds your paid engagement rate. And likewise, that paid impressions are far greater than organic impressions. This will help you build a complete social media strategy that considers the strengths and weaknesses of each so that you can use them both to their utmost advantage.
- Industry. Every industry has different benchmarks. Our clients are all service-based businesses, the majority of which are in B2B Tech/IT/Managed Services. Build your benchmarking data by understanding your industry, your competitors, and your own brand’s historical data.
Pro Tip: Before you begin building your industry-specific, custom benchmark report, identify your objectives so that you know which key metrics are meaningful for your brand.
Benchmarks by Objective
According to the latest research from LinkedIn, 95% of your audience is Out of Market at any given time. That means 95% of your audience requires constant nurturing to not only recognize your brand but to remember it should a need arise. Here are the most common objectives and related metrics for reaching your out-of-market audience:
Objective: Recognition, Attraction
Metrics: Organic Impressions, Organic Reach, Paid Impressions, Paid Reach
Objective: Nurture, Build community, Encourage engagement
Metrics: Engagements, Engagement Rate, Engagements by type (reactions, comments, shares, saves), Follower Growth Rate, Video View Rate
That leaves 5% of your audience that is In Market at any given time. These folks need a reason to choose you over your competitors. Here are the most common objectives and related metrics for in-market audiences.
Objective: Consideration, Conversion
Metrics: Saves, Clicks, Leads, Lead Form Views, Lead Form Completions, Conversions
Rather than pick one source for your industry benchmarks, look for those that take number of followers into account. Your data will change substantially as you grow. Also, take a snapshot that’s indicative of your sales and promotion cycles. Rather than pull data from a single month, take an average of the past several months or longer. Look at growth year over year, not just month to month. Spikes might happen, but a steady cadence of engagement, even when it feels like nothing is happening, is critical.
You can find benchmarks for every social media platform from Twitter and Instagram to TikTok and Snapchat. But here, we focus on LinkedIn benchmarks for B2B tech so that we can compare average industry benchmarks to our own clients’ data. We use Sprout Social to check in with our client’s top competitors and pull competitive benchmark data.
LinkedIn Benchmarks for B2B Tech
Organic Social Media Benchmarks
Organic Impressions. This tells you what percentage of your audience your organic social posts reach. The industry average for B2B tech is 3k/post. I find this to be quite high, especially for LinkedIn pages with fewer than 50k followers. Incorporating 2-3 relevant hashtags can help you improve impressions and reach, but without a paid media budget, you can generally expect this number to be quite a bit lower (1-3%).
Organic Engagements. Take an average over a specific period and divide by the number of published posts during that timeframe. For this exercise, we used a 4-month period. The average for B2B tech companies is about 9 engagements per post (taking an average of several credible sources). We found this average better suited to brands with fewer than 10k followers. Over 50k followers, the number of engagements should go up exponentially.
Organic CTR. Organic click through rate for top of funnel, low-barrier LinkedIn posts can be quite high. We took an average of several trusted sources to get 9.5% as an industry average.
Follower Growth. The industry average is anywhere between 1.3% and 2.7%. None of our clients reached 2% or higher without paid social media support. However, what you should be looking for here is a slow, steady increase over time. If you’re a new-to-LinkedIn brand, you may see much higher follower count growth rates when you begin engaging with your target audience. However, this should balance out over time.
Specific engagement metrics such as Shares, Reactions, and Comments paint a picture of how your audience feels about your brand, your services, and the topics you cover in thought leadership content. Pay close attention to which content receives shares and comments. Reactions are a quick win, and comments are rare in this space. Integrating your GA4 account into your Sprout Social dashboard can help you monitor and track patterns and upticks in page views so that you can attribute them correctly.
The social media industry benchmark for Comments is 5 – a number I rarely see. The average is closer to 0.25/post or one comment for every four posts. The best way to improve this is to leverage your executives. LinkedIn members are much more likely to engage with a professional’s personal posts than they are with a brand’s posts. This is just one of many reasons why executive social media thought leadership really does need to be part of your overall content strategy. Learn more about our Bespoke Executive Social Media Thought Leadership program here.
The most accurate and efficient way to monitor performance and keep tabs on your competition is with a social media dashboard like Sprout Social. Sprout recently unveiled Benchmarking data in Beta for Premium Analytics (PA) customers. This tool allows you to see how you compare to competitors in your industry based on where you fall in the percentile rankings. Remember that having the data is just the first step; you need to be sure you can uncover actionable insights from that data.
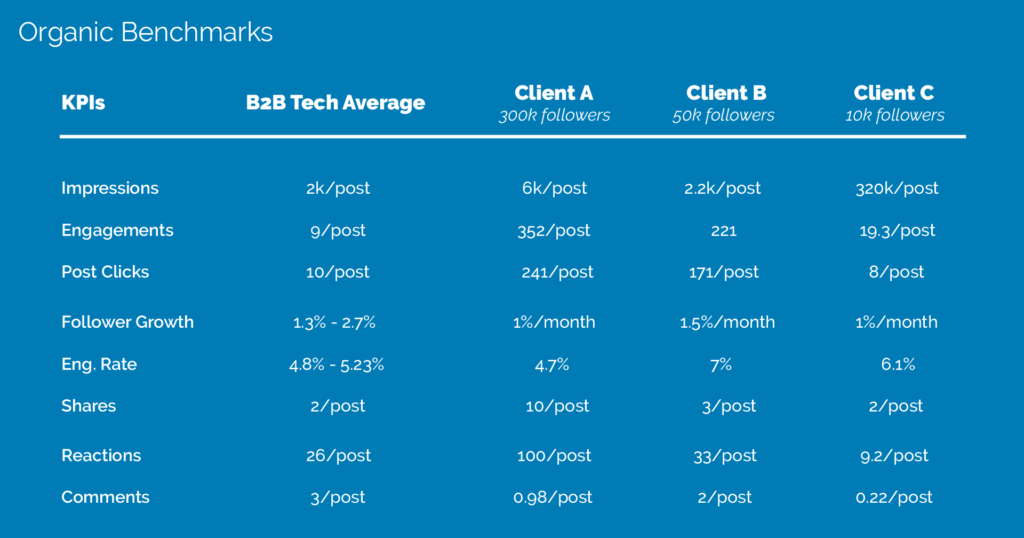
In the table above, you can see how a brand’s number of followers impacts metrics. This is why we use a combination of sources and historical data to create benchmarks.
Dark Social and the Consumption Benchmark
There’s one social media benchmark that’s not in the above table: Dark Social. Dark social is all the social media engagements and shares that happen under the radar. This is not the same as private social media engagements, which are the actions that other followers can’t see such as video views, link clicks, and photo clicks. Dark social media engagements are typically either attributed to the wrong source or they’re completely untraceable.
No social media analytics tool can tell you when one of your LinkedIn followers shares a statistic from one of your blog posts with a colleague. It can’t correctly attribute the website visit when that colleague looks you up online to learn more about what you offer. And that doesn’t even begin to address the social media “lurkers” who follow you but never comment, like, or share your content. That doesn’t mean they don’t engage because, as Shama Hyder said recently in a LinkedIn comment, “Consumption IS engagement.” And she’s 100% correct. In fact, I would argue that consumption is a much stronger engagement metric than any of the vanity metrics. I’ve tested this theory, and while it’s nice to see so many “likes” on a social media post, how many of those people do you think took the time to click the link and read your content?
Likes and comments do not equal consumption. But if your goal is to build brand awareness and increase followers, likes and comments can help, because humans are an interesting species. We tend to follow the herd.
The Herd Phenomenon
There’s a busy 4-lane road where I live that leads to a highway. There’s a streetlight at the on-ramp, and there are two lanes leading to that on-ramp, the right lane of which merges into the left about a third of the way in. Every time I’m heading that way, there’s a long line of cars in the left turn line. Rarely is there even a single car in the right lane. I always choose the right line (that’s P2 for all you F1 fans). Once I do, a strange thing happens: other cars fall in behind me. In much the same way, few of your social media followers want to be the first – or even the second or third – to “like” a post. But as soon as that post has 10 likes or so, others will start to react, too. And no one will comment until someone else comments. And then if several people comment with specific mentions of something interesting in your content, other followers are more likely to click the link and read it themselves. No one wants to be first (or last, that’s FOMO talking).
So, what does that mean for your brand’s content? And how can you capture the consumption metric? Google Analytics tells you how many people viewed a page on your website. Generally, social media marketers focus on the traffic channel, searching for direct traffic from LinkedIn or other social platforms. Start paying attention to your direct traffic. Not just the total, but how it changes over time. Overlay that statistic with the dates and times of your LinkedIn posts, and you’ll likely start to see patterns. Sprout Social makes this easier by integrating with your Google Analytics account.
The Key to Real Growth
Algorithm changes and good, old-fashioned capitalism have created a pay-to-play game out of nearly all social networks, but before you throw your organic social media efforts out the window, keep in mind that for most marketers, organic is a more valuable tactic than paid. In fact, according to Sprout Social’s recent Pulse survey, marketers rank organic social media as the most important tactic in their marketing strategy.
Still, it’s paid social media that will help you reach new audiences, target your ideal audience, drive leads, and build your social media following. Benchmarks for paid social media are not as clear-cut as their organic counterparts. That’s because there are so many variables to consider.
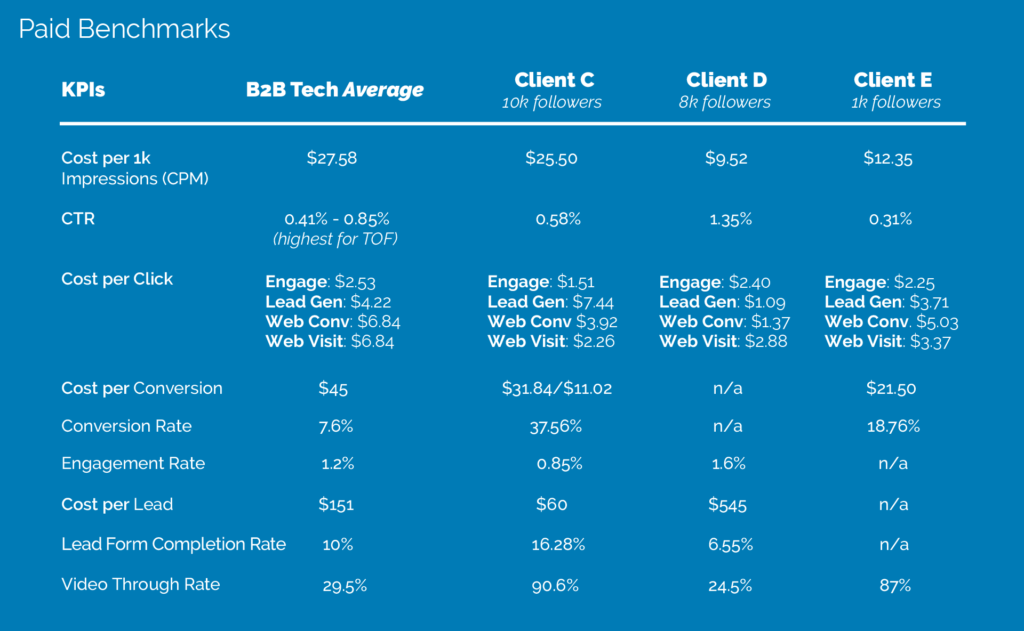
Paid Social Media Benchmarks
Your marketing strategy must include paid social media if you want to grow your LinkedIn audience, target prospects, and drive traffic to your website.
The data depend on a multitude of factors from your target audience’s title/role to your industry. If you are running a top of funnel ad with the objective of driving readers to your website to read a blog post, for example, your click thru rate will be much higher because the lift is much lighter. This is why you see such a wide range in the table below for CTR.
Remember that the KPIs you measure should be closely aligned with your goals. If your objective is to generate a list of leads with a LinkedIn Lead Gen form, don’t worry too much if your CTR is lower than benchmark – there’s likely a straightforward fix for that. Focus instead on the lead form views and conversions.
According to FirstPageSage.com, the average conversion rate for a B2B content marketing campaign falls between .8% and 1.1%. This is THE metric your leadership team cares about. It’s the KPI that will justify your social media campaign – and your budget.
Use the forecasting tool in LinkedIn Campaign Manager to give you and your team a sense of what you should expect from your ad, then take industry benchmarks and your own historical data into consideration.
Optimizing Paid Social Media: A Study in Details
One of our core B2B tech clients began running two LinkedIn sponsored content ads. They set the ad up for 30 days. Their primary goal was to generate leads via a LinkedIn Lead Form. They retargeted a well-nurtured audience in addition to a look-alike audience and core job titles.
But something was causing poor performance. After an in-depth review of their ad performance, we redesigned the creative, edited the messaging, and restructured the a/b test. We saw an immediate improvement.
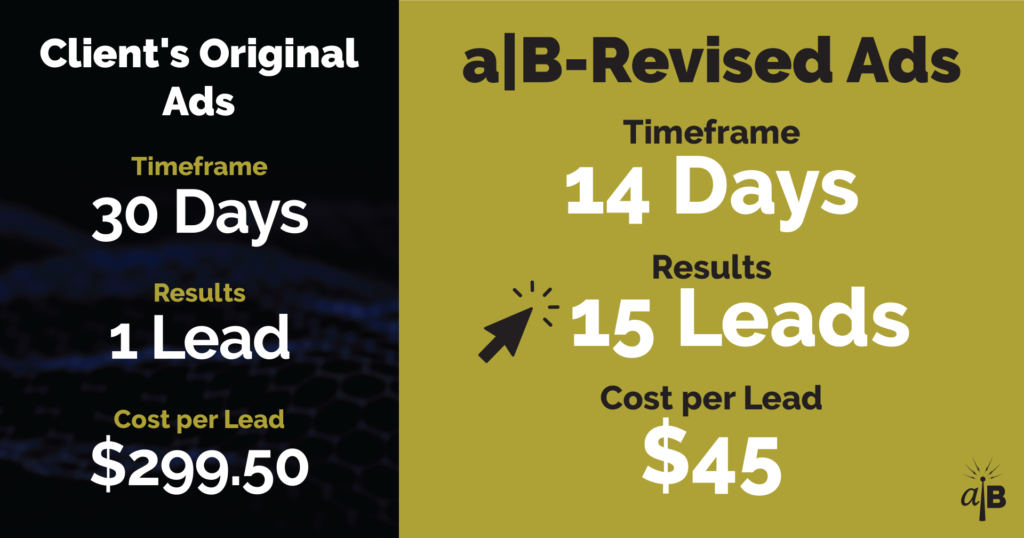
A $45 CPL is the lowest this client has ever seen, not just on LinkedIn, but across every channel, including Google. The results are impressive, but it’s not rocket science – it’s know-how. Bringing in a consultant or agency who understands your industry and has ample experience can be the difference between a mediocre campaign and one that crushes your benchmarks, impresses stakeholders, and locks in budget for future campaigns.
You and I both know how important organic social media is to your overall strategy, and we both know that you need paid social support. But what it comes down to in terms of budget approval? That’s all leads, my friend. Let’s give ‘em what they want!
Benchmarking your social media results helps stakeholders and executives quickly compare your brand’s results to the industry average, but sometimes those averages vary wildly and can create a distraction that isn’t worth the time. Use your own historical data and a mix of trusted sources to create benchmarks that will help your brand reach goals and celebrate milestones.
Need a hand with social media strategy or social media management?
Sources:
https://www.socialstatus.io/insights/social-media-benchmarks/
https://www.koroberi.com/resources/b2b-marketing-benchmarks/
https://blog.adstage.io/twitter-cpm-cpc-ctr-benchmarks
https://www.brafton.com/blog/social-media/social-advertising-benchmarks/
https://www.socialinsider.io/blog/social-media-industry-benchmarks/
https://firstpagesage.com/seo-blog/linkedin-organic-benchmarks-roi-fc/
https://databox.com/measure-linkedin-page-performance
https://firstpagesage.com/seo-blog/b2b-content-marketing-benchmarks-your-guide-fc/